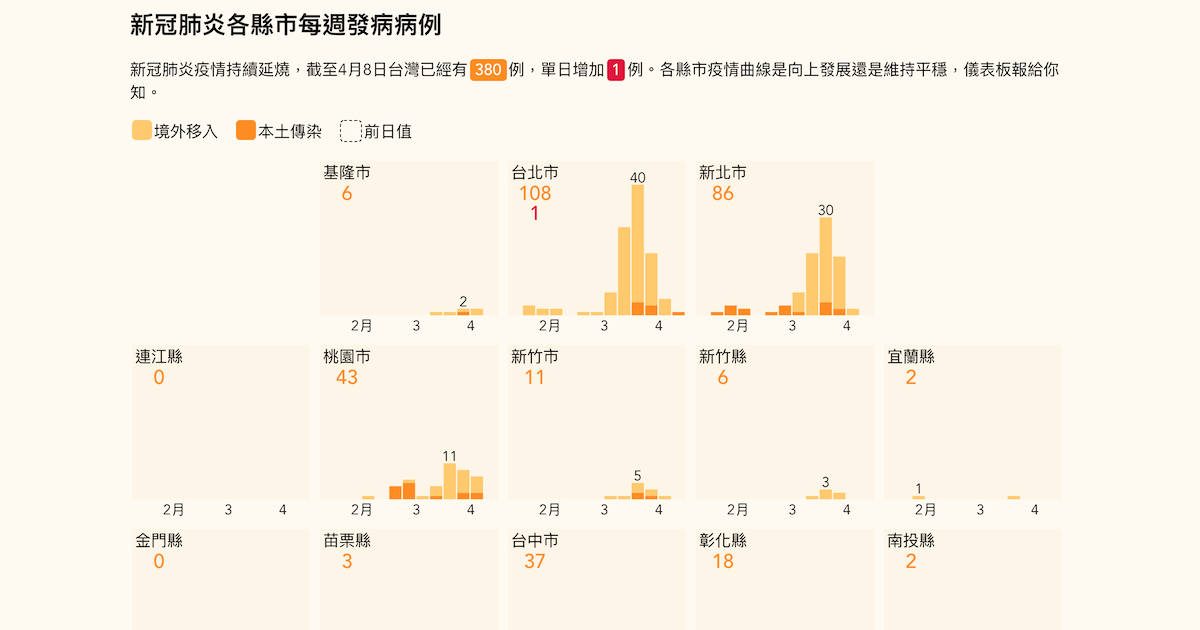
Weekly New Cases in Taiwan
A simple visualization showing weekly new cases in each county in Taiwan. Square map for geographical reference. Tools: Vue, D3.
COVID-19 adjusted map
Adjust state size according to how many cases are there in each state. transform-box and transform-origin are used to create the shrinking effect. First Observable notebook!
Coronavirus global tracker
Maps and charts for latest numbers of coronavirus outbreak. Simple backend is implemented with Google Apps Script and Node. Tools: D3.js.
Know your legislators by the numbers
An interactive that lets you find out who are Taiwan's new legislators. Tools: Scrollama.js, D3.js.

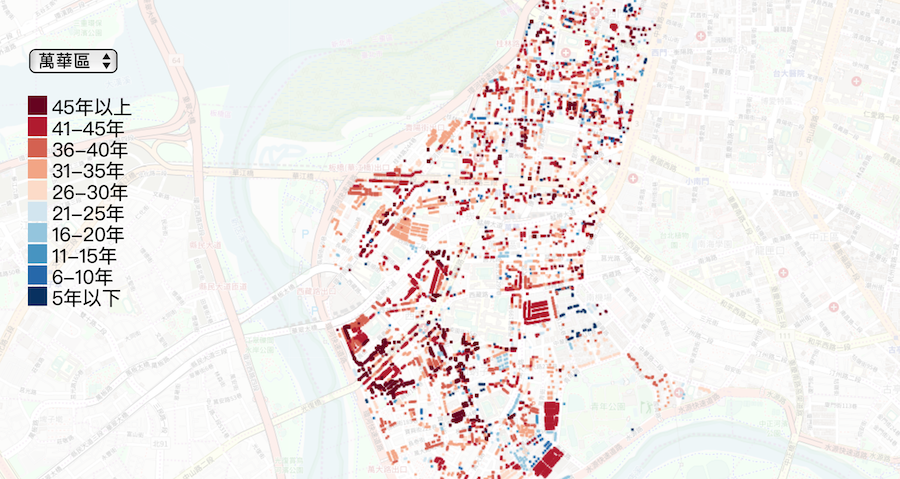
Housing Age Map of Taipei V2
An upgraded version of the Taipei housing age map using Vue.js and Turf.js.
Taiwan Pop Characteristics 2019
A simple map application built with Vue and Mapbox GL JS providing details of demography in Taiwan.
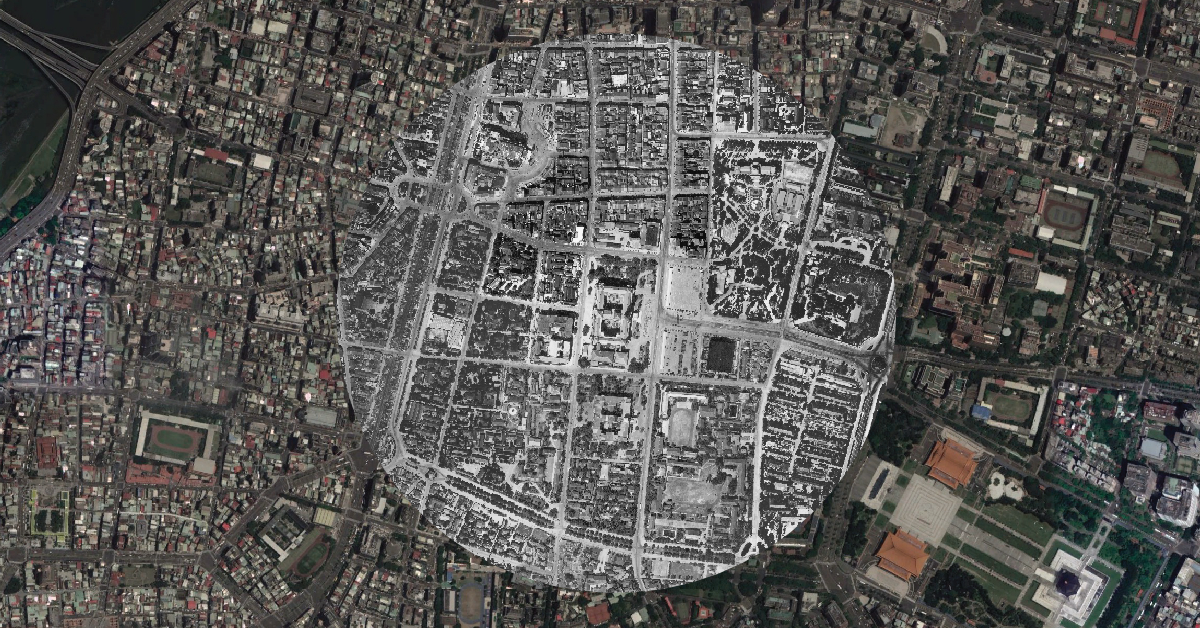
A Lens to Taipei in 1957
Use QGIS-processed satellite image and historical aerial image to display changes of Taipei streets.
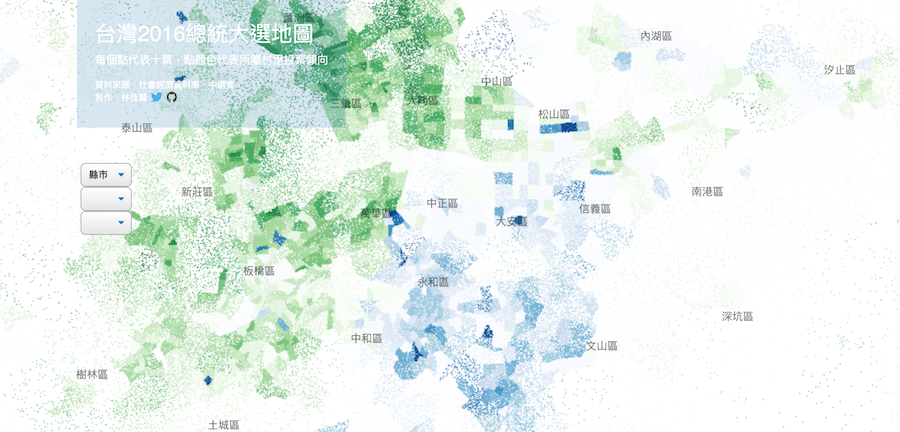
2016 Taiwan election dot map
Built a dot map to show the result of 2016 Taiwan presidential election. QGIS for map tiles and Mapbox GL JS for tooltip/navigation.
Taiwan population density map
Used Mapbox GL JS to build an interactive map showing population density in Taiwan in three levels of administrative division.
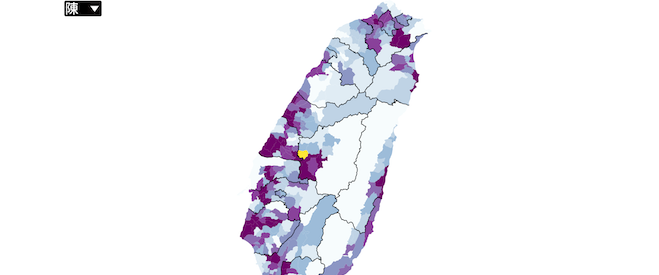
Taiwan family name map
Goverment data on geographical distribution of major family names in Taiwan was used to draw this interactive map. D3js and R were used.
2018 Taiwan election map
I built interactive maps to show the voting results of nearly 8,000 villages and boroughs in Taiwan. D3js, QGIS and R were used.
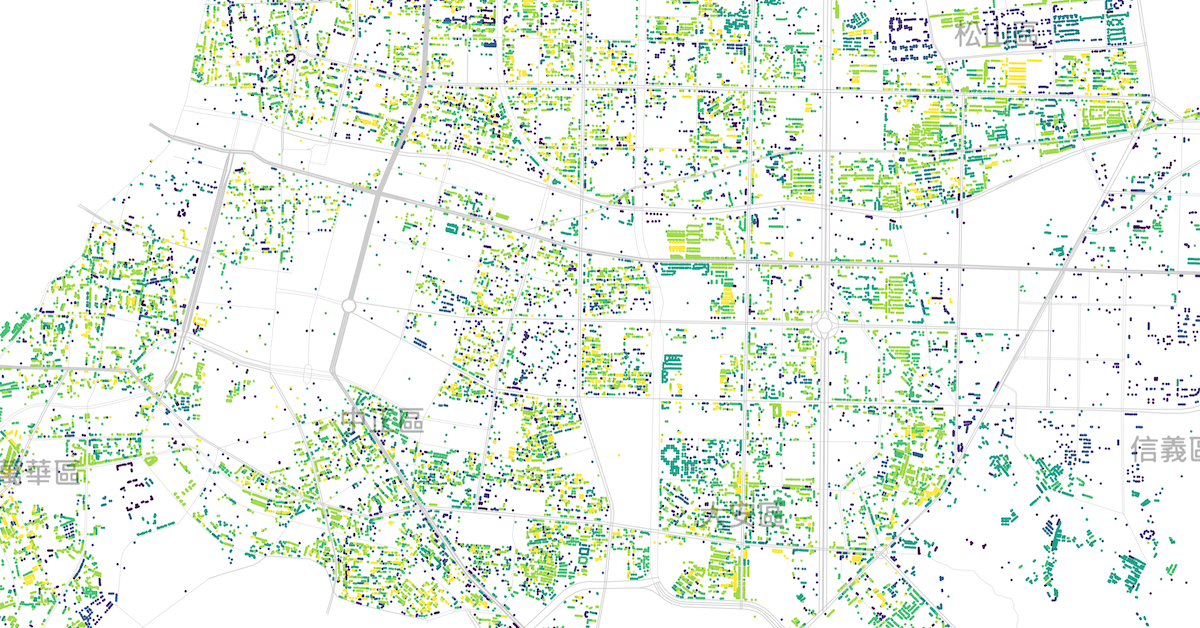
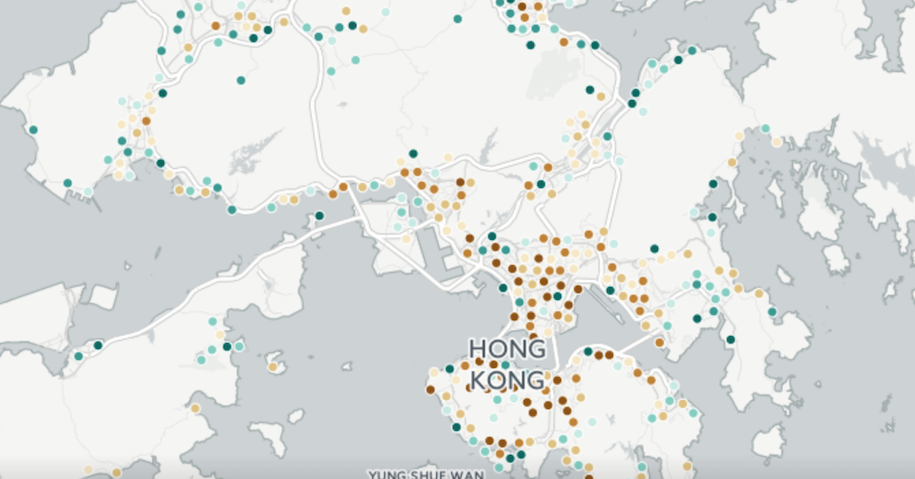
Taipei housing age map
I wrote a crawler to scrape construction permit data and geocoded the address. The interactive map was built with d3js and canvas.
Pirate activitiy interactive map
Use d3js and canvas to build an interactive map. You can click on the arrows and dots to control the narrative.
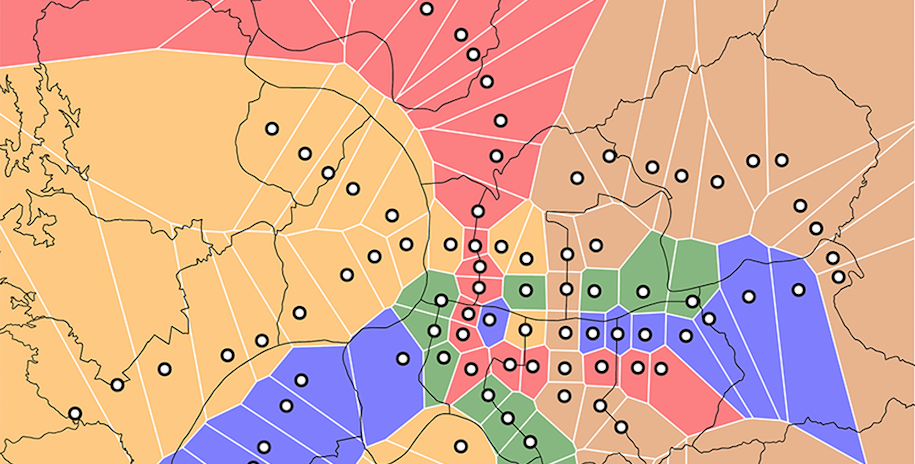
One's borough's metro station
Use map to find out why MRT station "Xiaobitan"'s passenger volume is so low , utilizing voronoi diagram and Google map
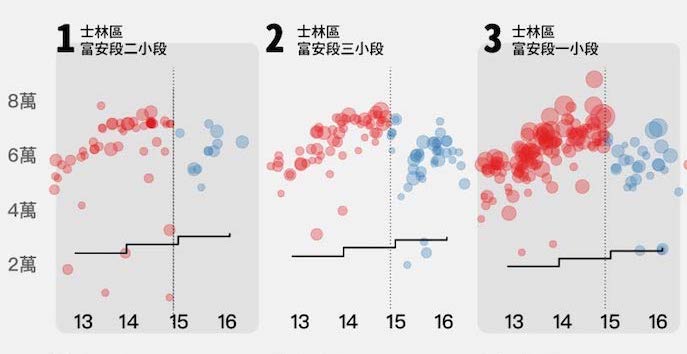
Shezi's land price
Use government land actual selling price data to find out how land price of Shezi, one of the last regions of Taipei as-yet-unexploited, rise and fall
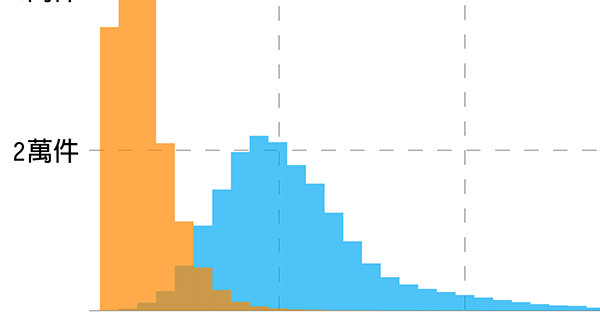
Sortable house price
Use D3 to chart historical house price of Taiwan's 22 counties in the past 4 years
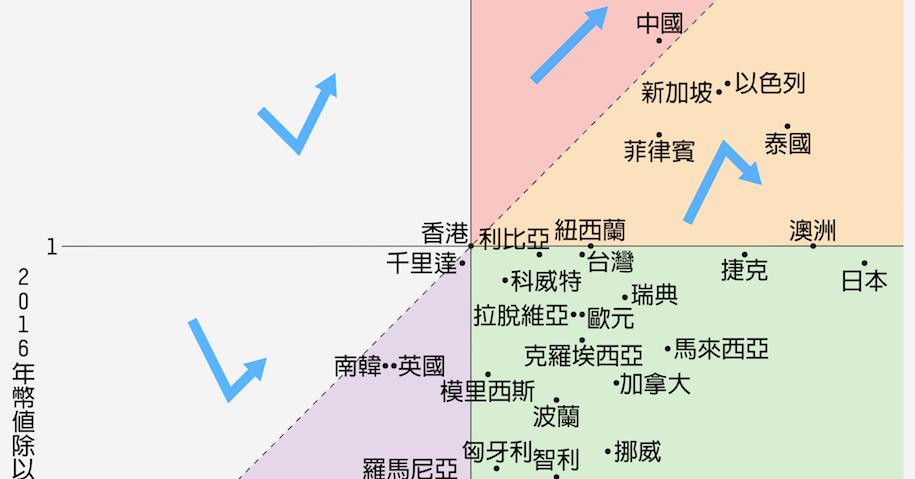
World Currency exchange rate chart
Use world's main currency historical price data to analyze the winner and losers of currency market
Taiwan county elder ratio
Use government data and D3 to draw Taiwan elder ratio map with autoplay feature